TMS-EEG Methodological advancement
Advancing TMS-EEG Methodologies for Probing Prefrontal Cortical Excitability and Inhibition
In my research on neuromodulation for psychiatric disorders, particularly treatment-resistant depression (TRD), I have contributed to several studies using transcranial magnetic stimulation combined with electroencephalography (TMS-EEG) to characterize cortical responses in the dorsolateral prefrontal cortex (DLPFC). This work focuses on disentangling true cortical reactivity from sensory artifacts, optimizing stimulation parameters, and exploring how ongoing brain oscillations influence TMS outcomes. These efforts align with my goal of developing reliable biomarkers and personalized interventions to enhance therapeutic efficacy.
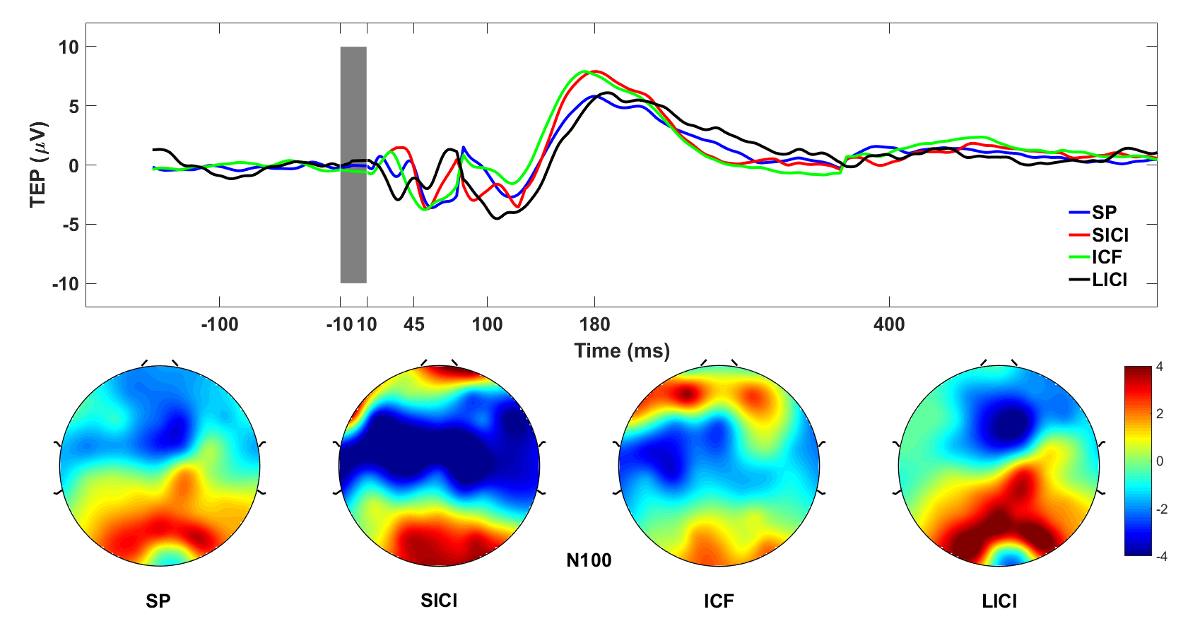
A foundational contribution was developing and validating a standardized protocol for neuronavigated TMS-EEG (nTMS-EEG) targeting the DLPFC (Lioumis et al., 2018). This method enables precise, reproducible assessment of cortical excitability and cortico-cortical connectivity, incorporating single-pulse TMS for excitability and paired-pulse paradigms for short intracortical inhibition (SICI), long intracortical inhibition (LICI), and intracortical facilitation (ICF). Applied in healthy volunteers and patients with depression, it facilitates test-retest paradigms to monitor changes from treatments like repetitive TMS (rTMS), magnetic seizure therapy (MST), and electroconvulsive therapy (ECT), while addressing artifacts through masking and careful coil positioning.
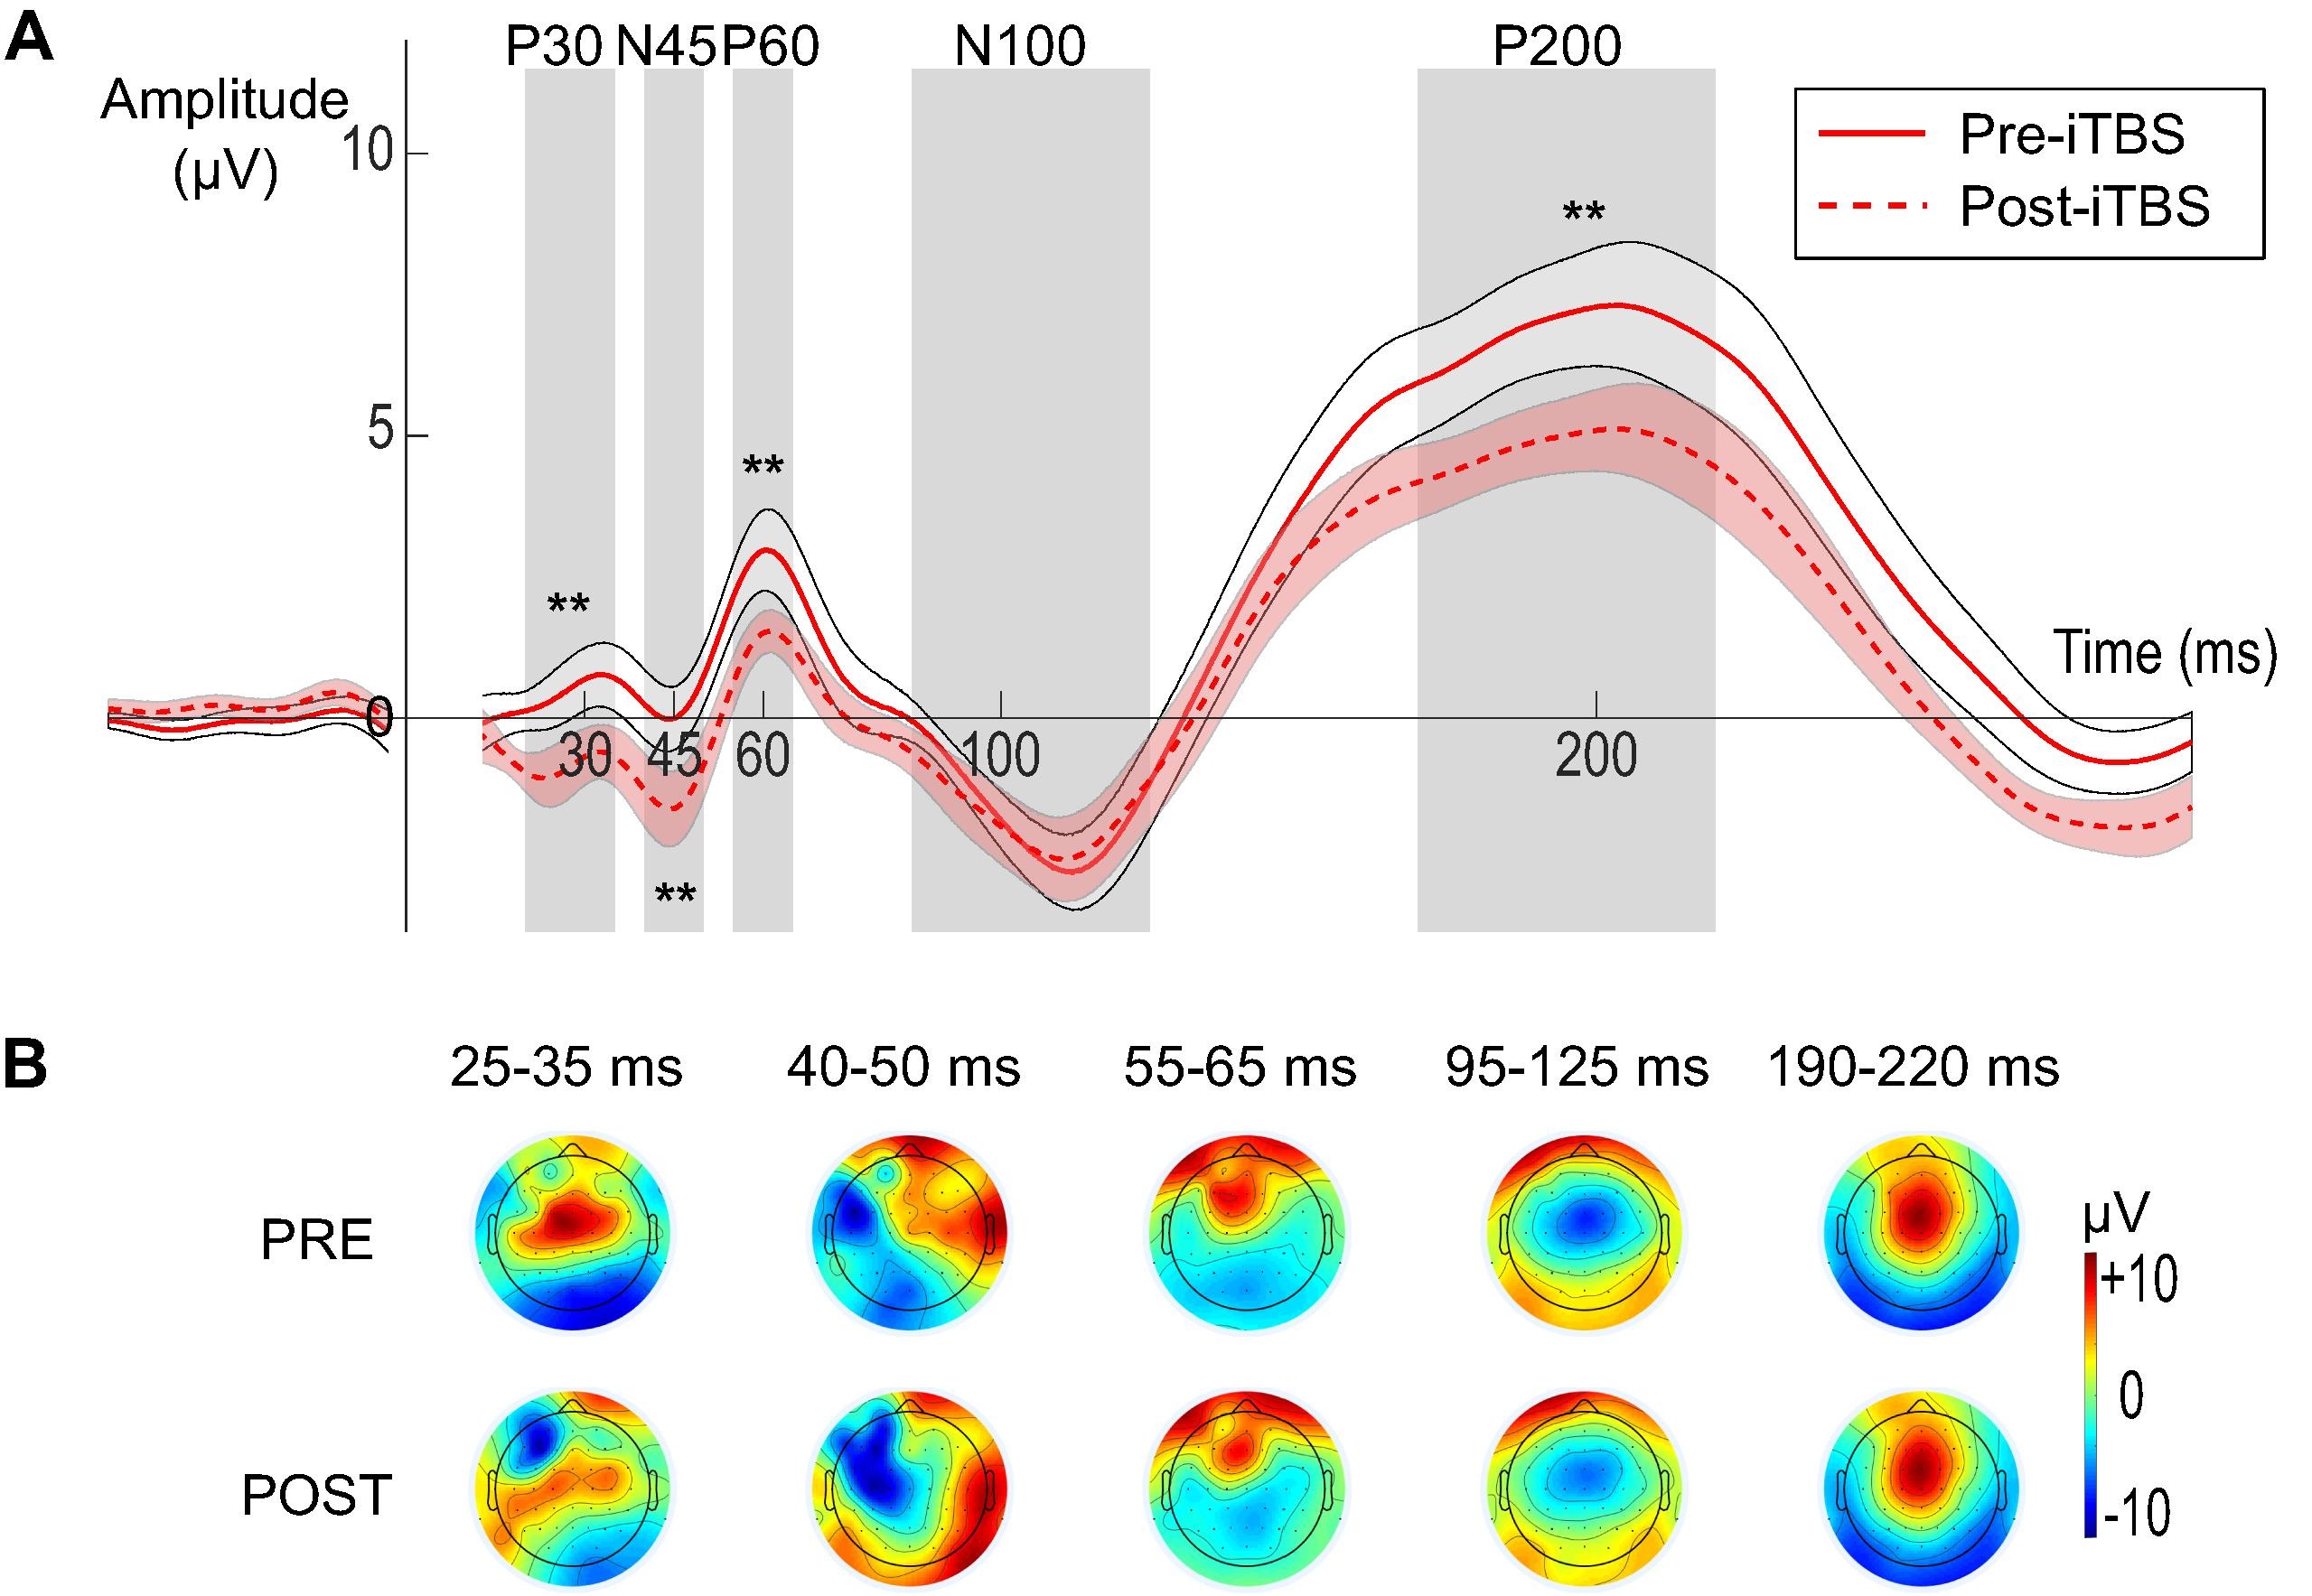
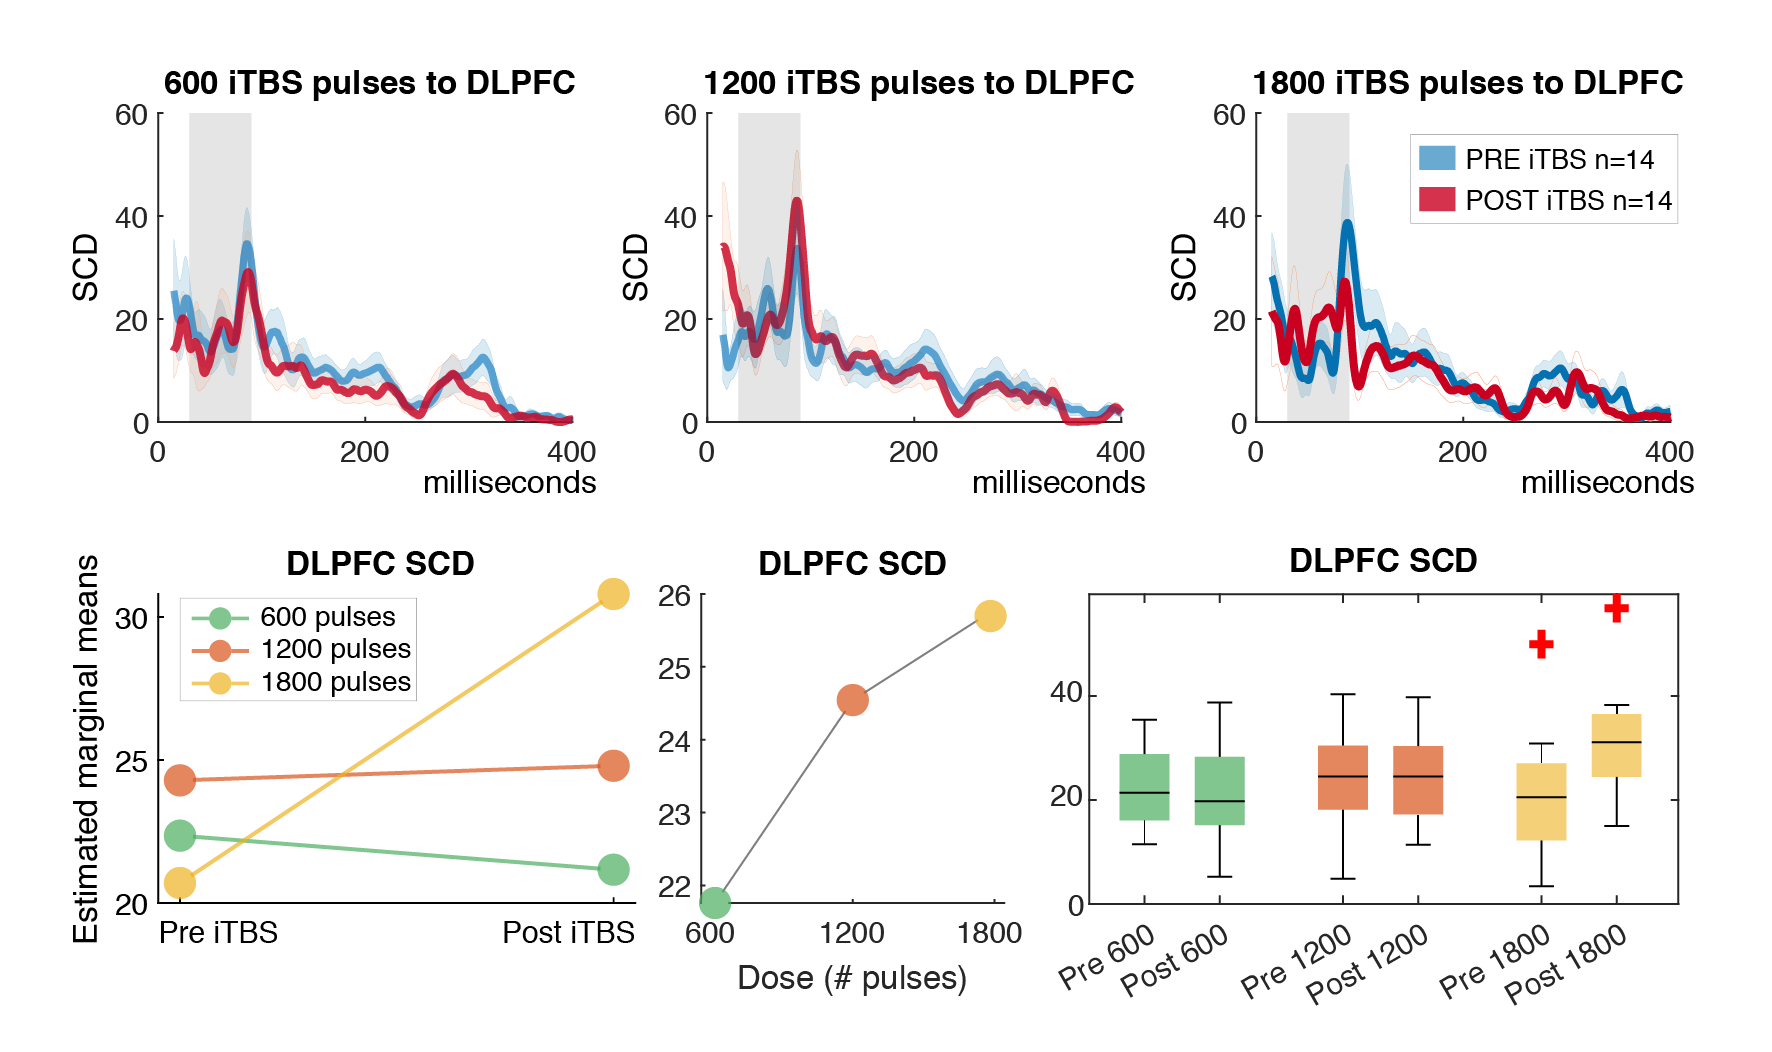
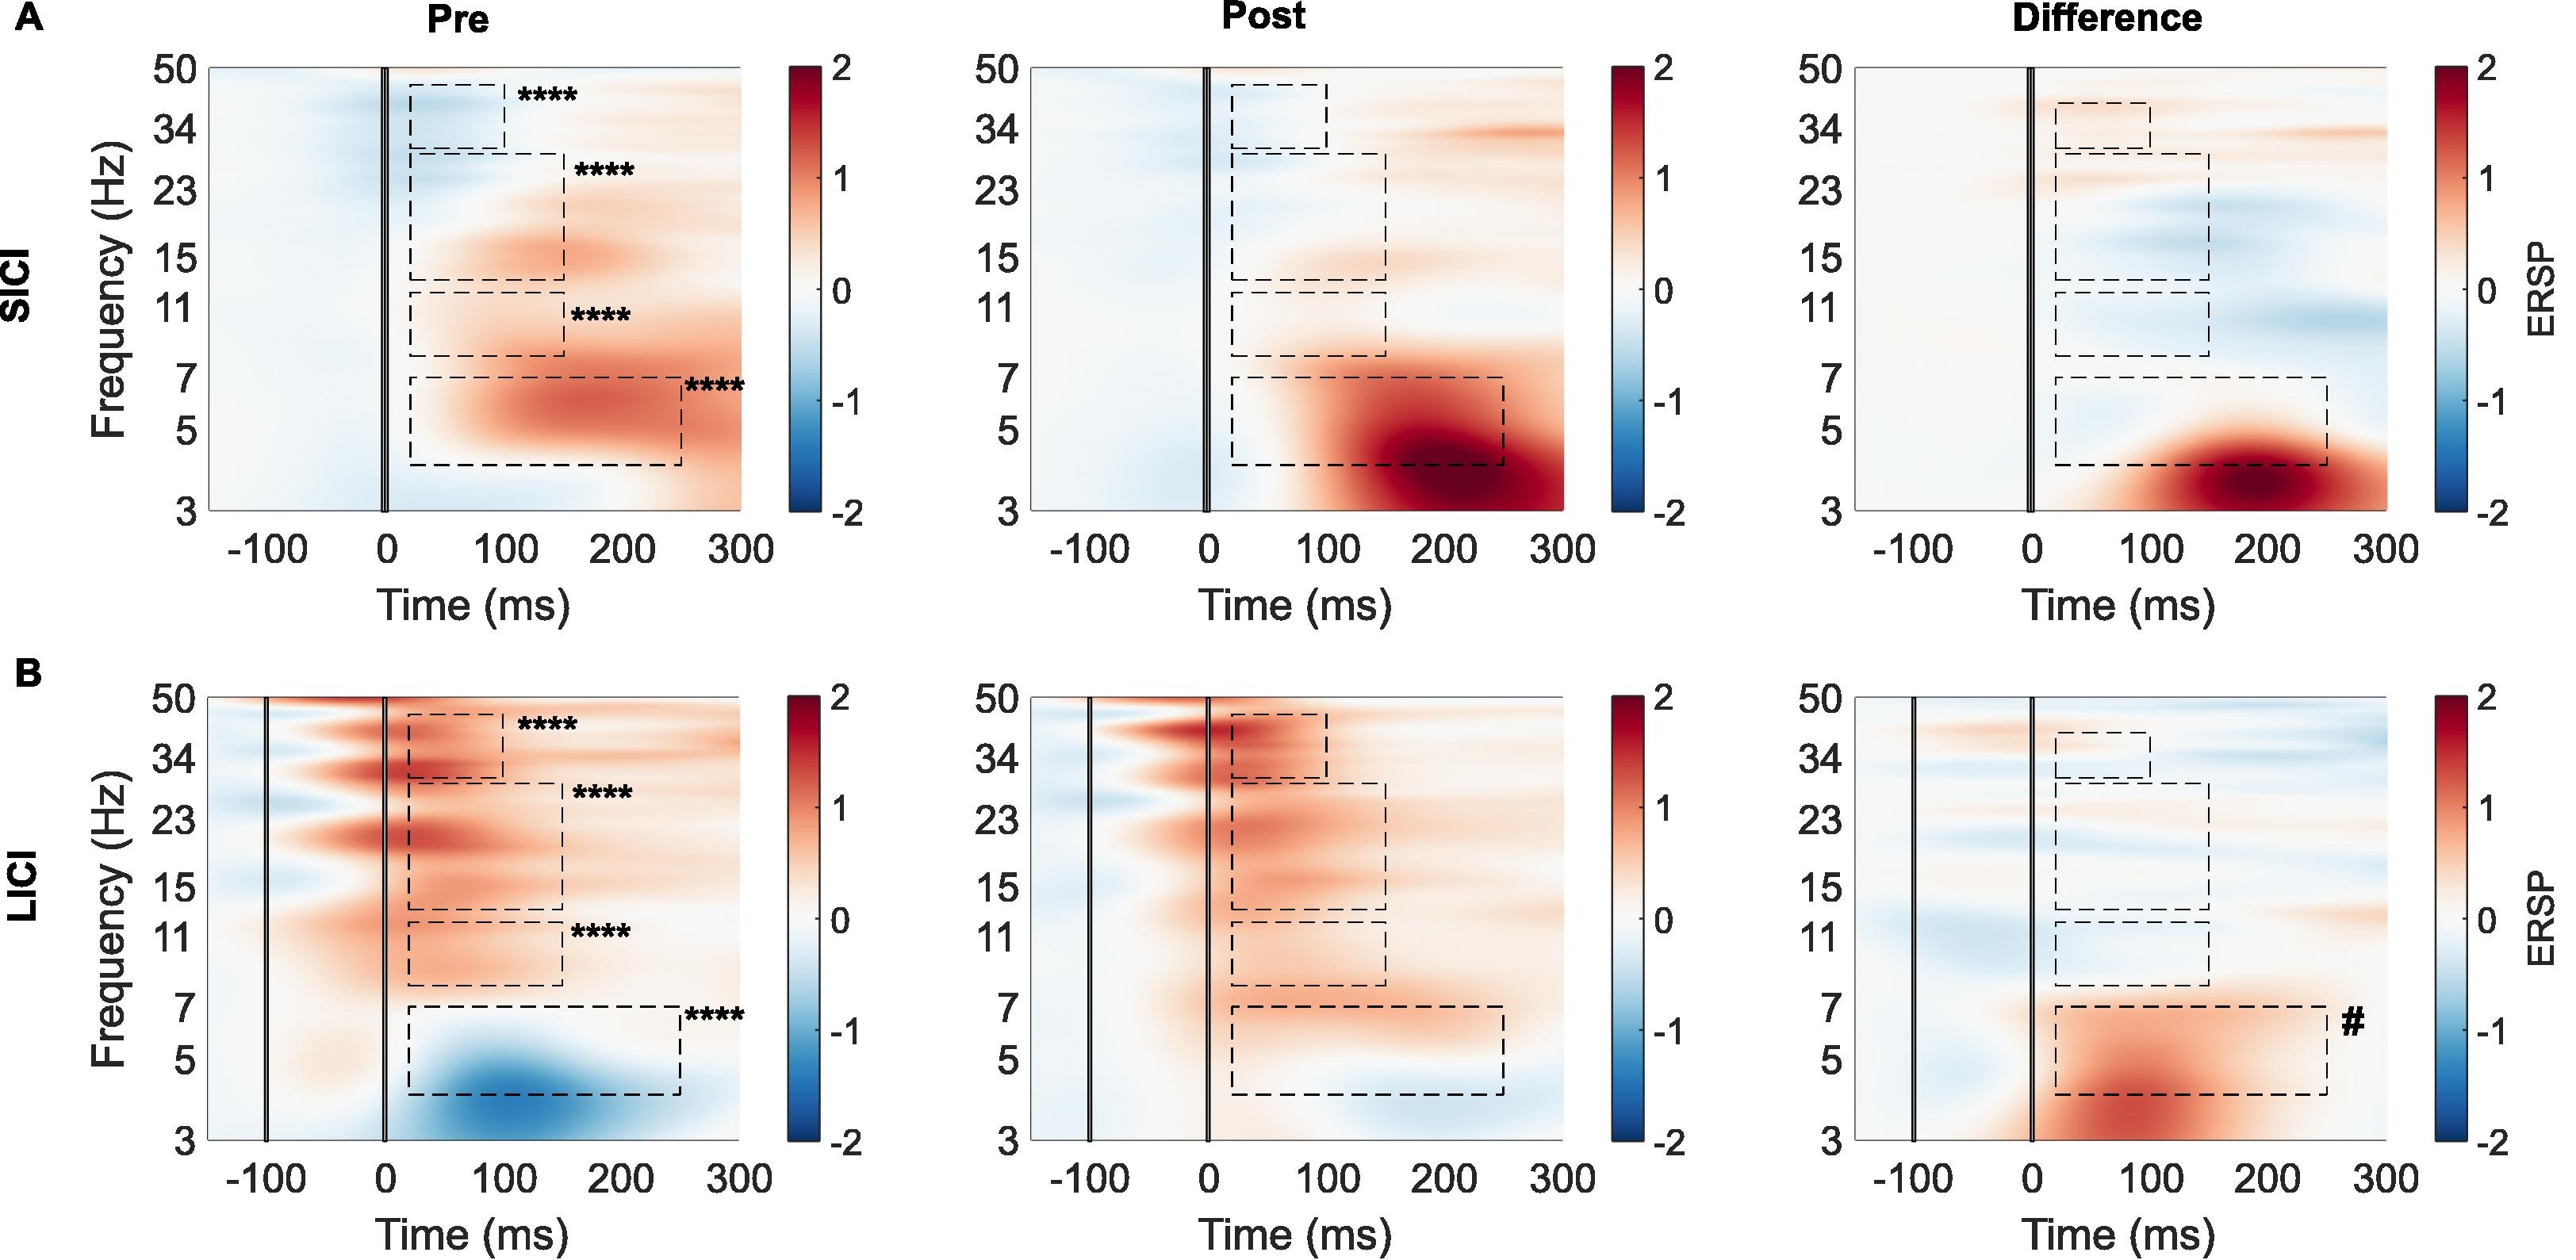
Building on this methodology, one key study examined the dose-response effects of intermittent theta-burst stimulation (iTBS) on DLPFC activity (Desforges et al., 2022). We compared 600, 1200, and 1800 pulses using TMS-EEG in healthy participants, finding no significant differences in modulation of TMS-evoked potentials (TEPs) or oscillatory activity across doses. However, all iTBS conditions altered TEP components (e.g., P30, N45, P60, P200) and reduced theta-band power, suggesting a common mechanism involving excitation-inhibition balance. This implies that higher doses may not necessarily amplify prefrontal potentiation, informing clinical protocols for TRD. To promote reproducibility, I have made the Matlab code for preprocessing and analyzing significant current density (SCD) and current scattering (SCS) metrics from this study openly available in my GitHub repository: github.com/ItayHadas/DLPFC_SCD_SCS_analysis. The repository includes automated TMS-EEG pipelines (based on the AARATEP Pipeline Cline et al., 2021), Brainstorm-based source localization and time-series analysis scripts, and statistical analysis tools like repeated-measures ANOVA for evaluating iTBS effects between diffrent doses and study phases.
Building on this methodology, one key study examined the dose-response effects of intermittent theta-burst stimulation (iTBS) on DLPFC activity (Desforges et al., 2022). We compared 600, 1200, and 1800 pulses using TMS-EEG in healthy participants, finding no significant differences in modulation of TMS-evoked potentials (TEPs) or oscillatory activity across doses. However, all iTBS conditions altered TEP components (e.g., P30, N45, P60, P200) and reduced theta-band power, suggesting a common mechanism involving excitation-inhibition balance. This implies that higher doses may not necessarily amplify prefrontal potentiation, informing clinical protocols for TRD.
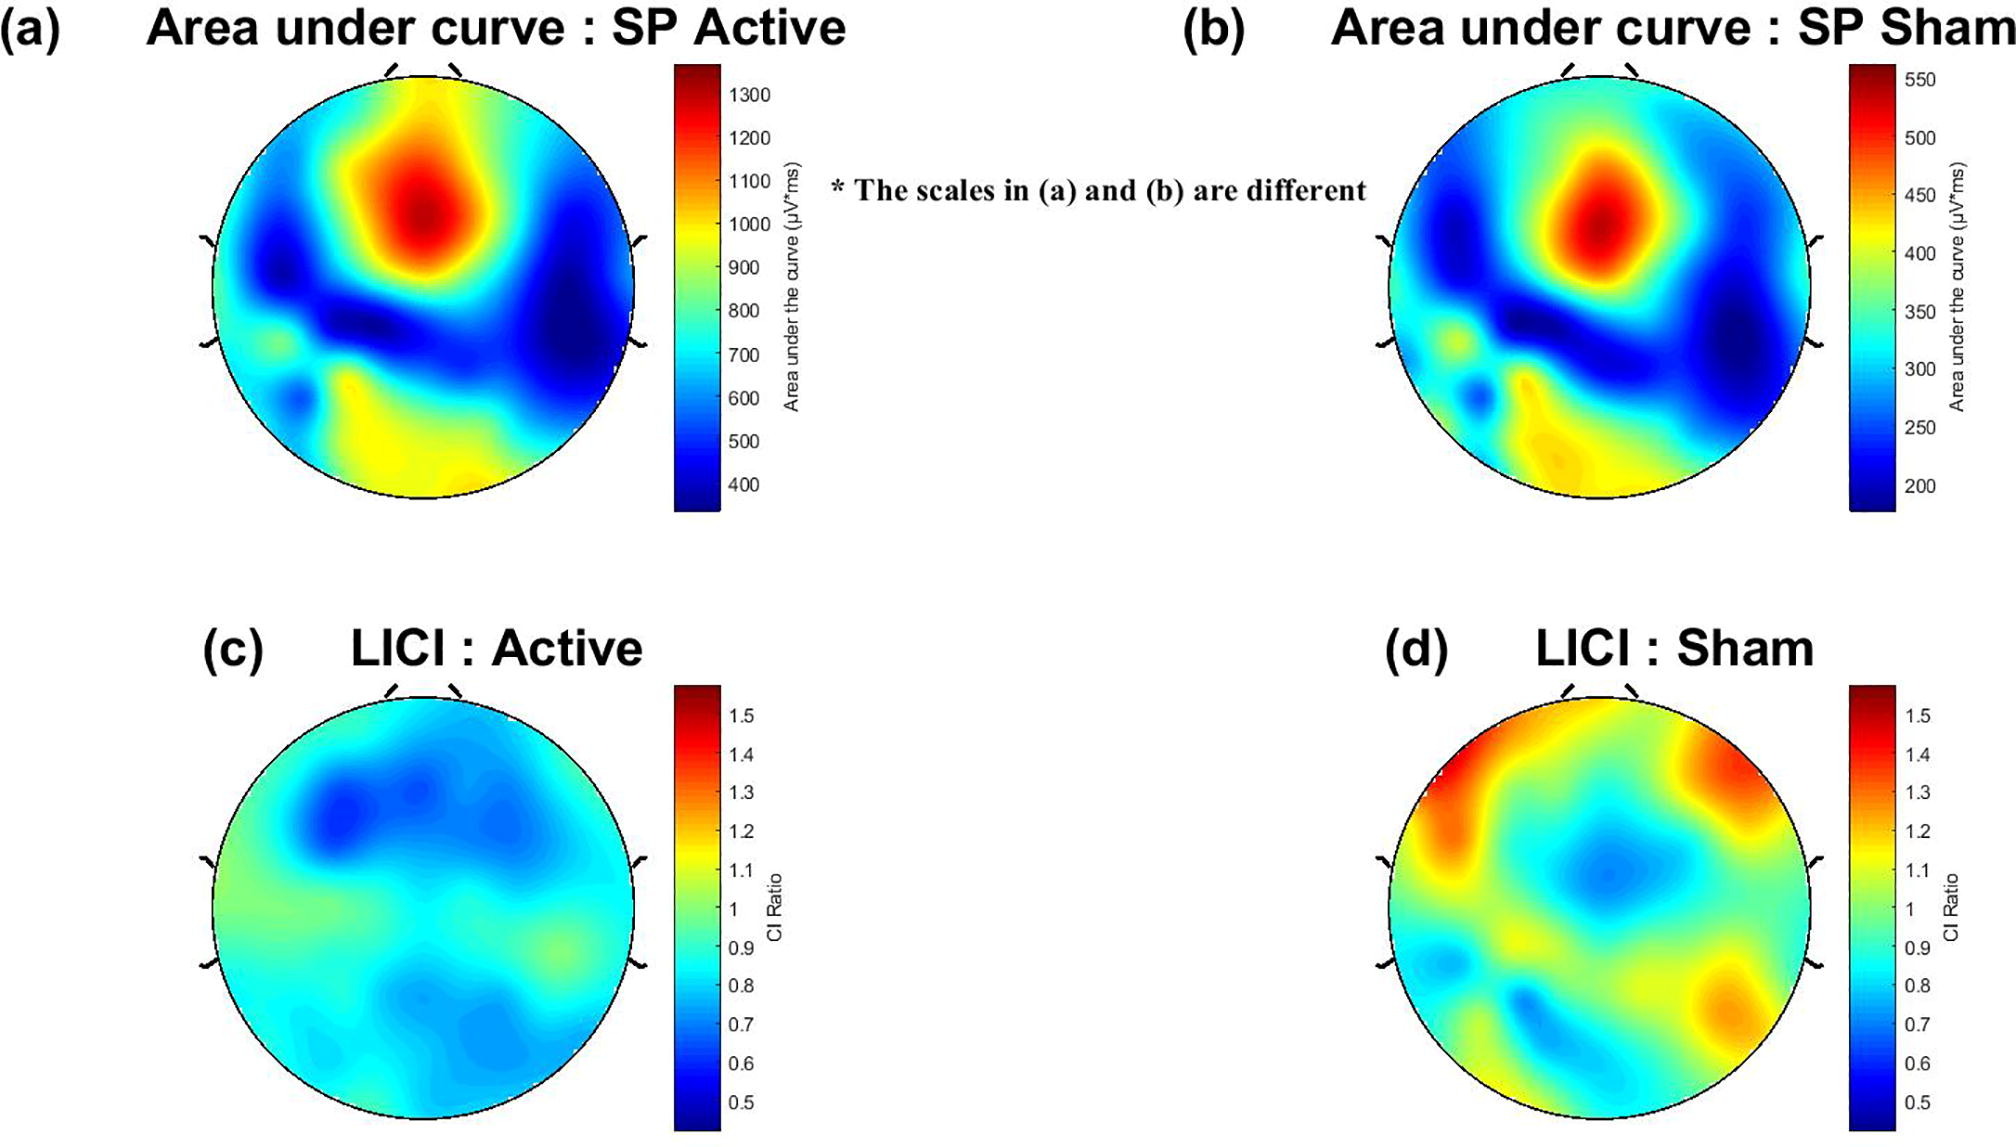
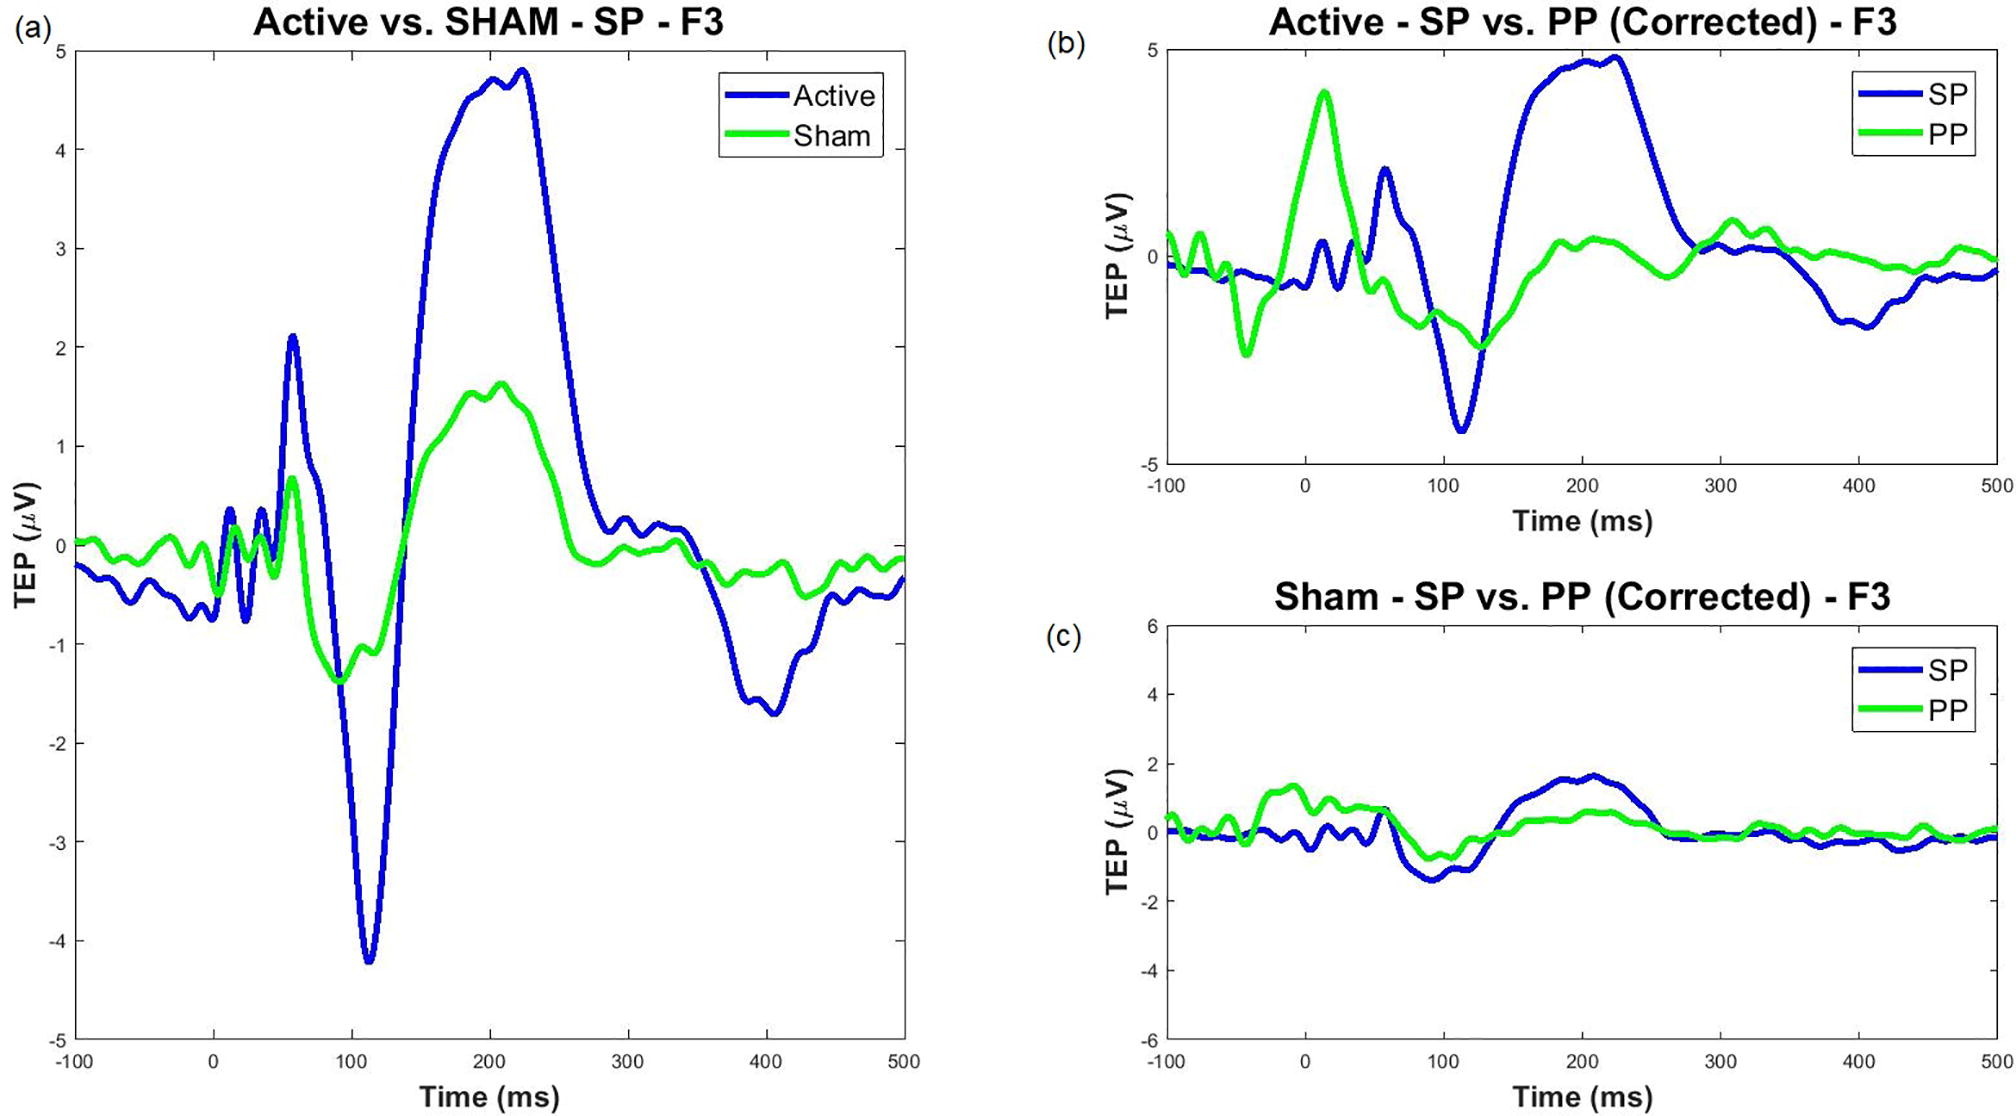
We also addressed sensory confounds in TMS-EEG signals. In Poorganji et al. (Poorganji et al., 2021), we differentiated cortical from auditory responses using single-pulse (SP) and paired-pulse (PP; LICI) protocols over DLPFC. Active TMS elicited larger TEPs (e.g., N100-P200 amplitude) and broader oscillatory inhibition compared to sham, confirming that true cortical effects dominate when artifacts are controlled. Similarly, in Poorganji et al. (Poorganji et al., 2023), we isolated somatosensory and auditory artifacts during suprathreshold stimulation, showing that masking (e.g., foam spacers and noise) attenuates non-cortical contributions while preserving significant cortical excitability and inhibition metrics like cortical evoked activity (CEA) and global mean field amplitude (GMFA).
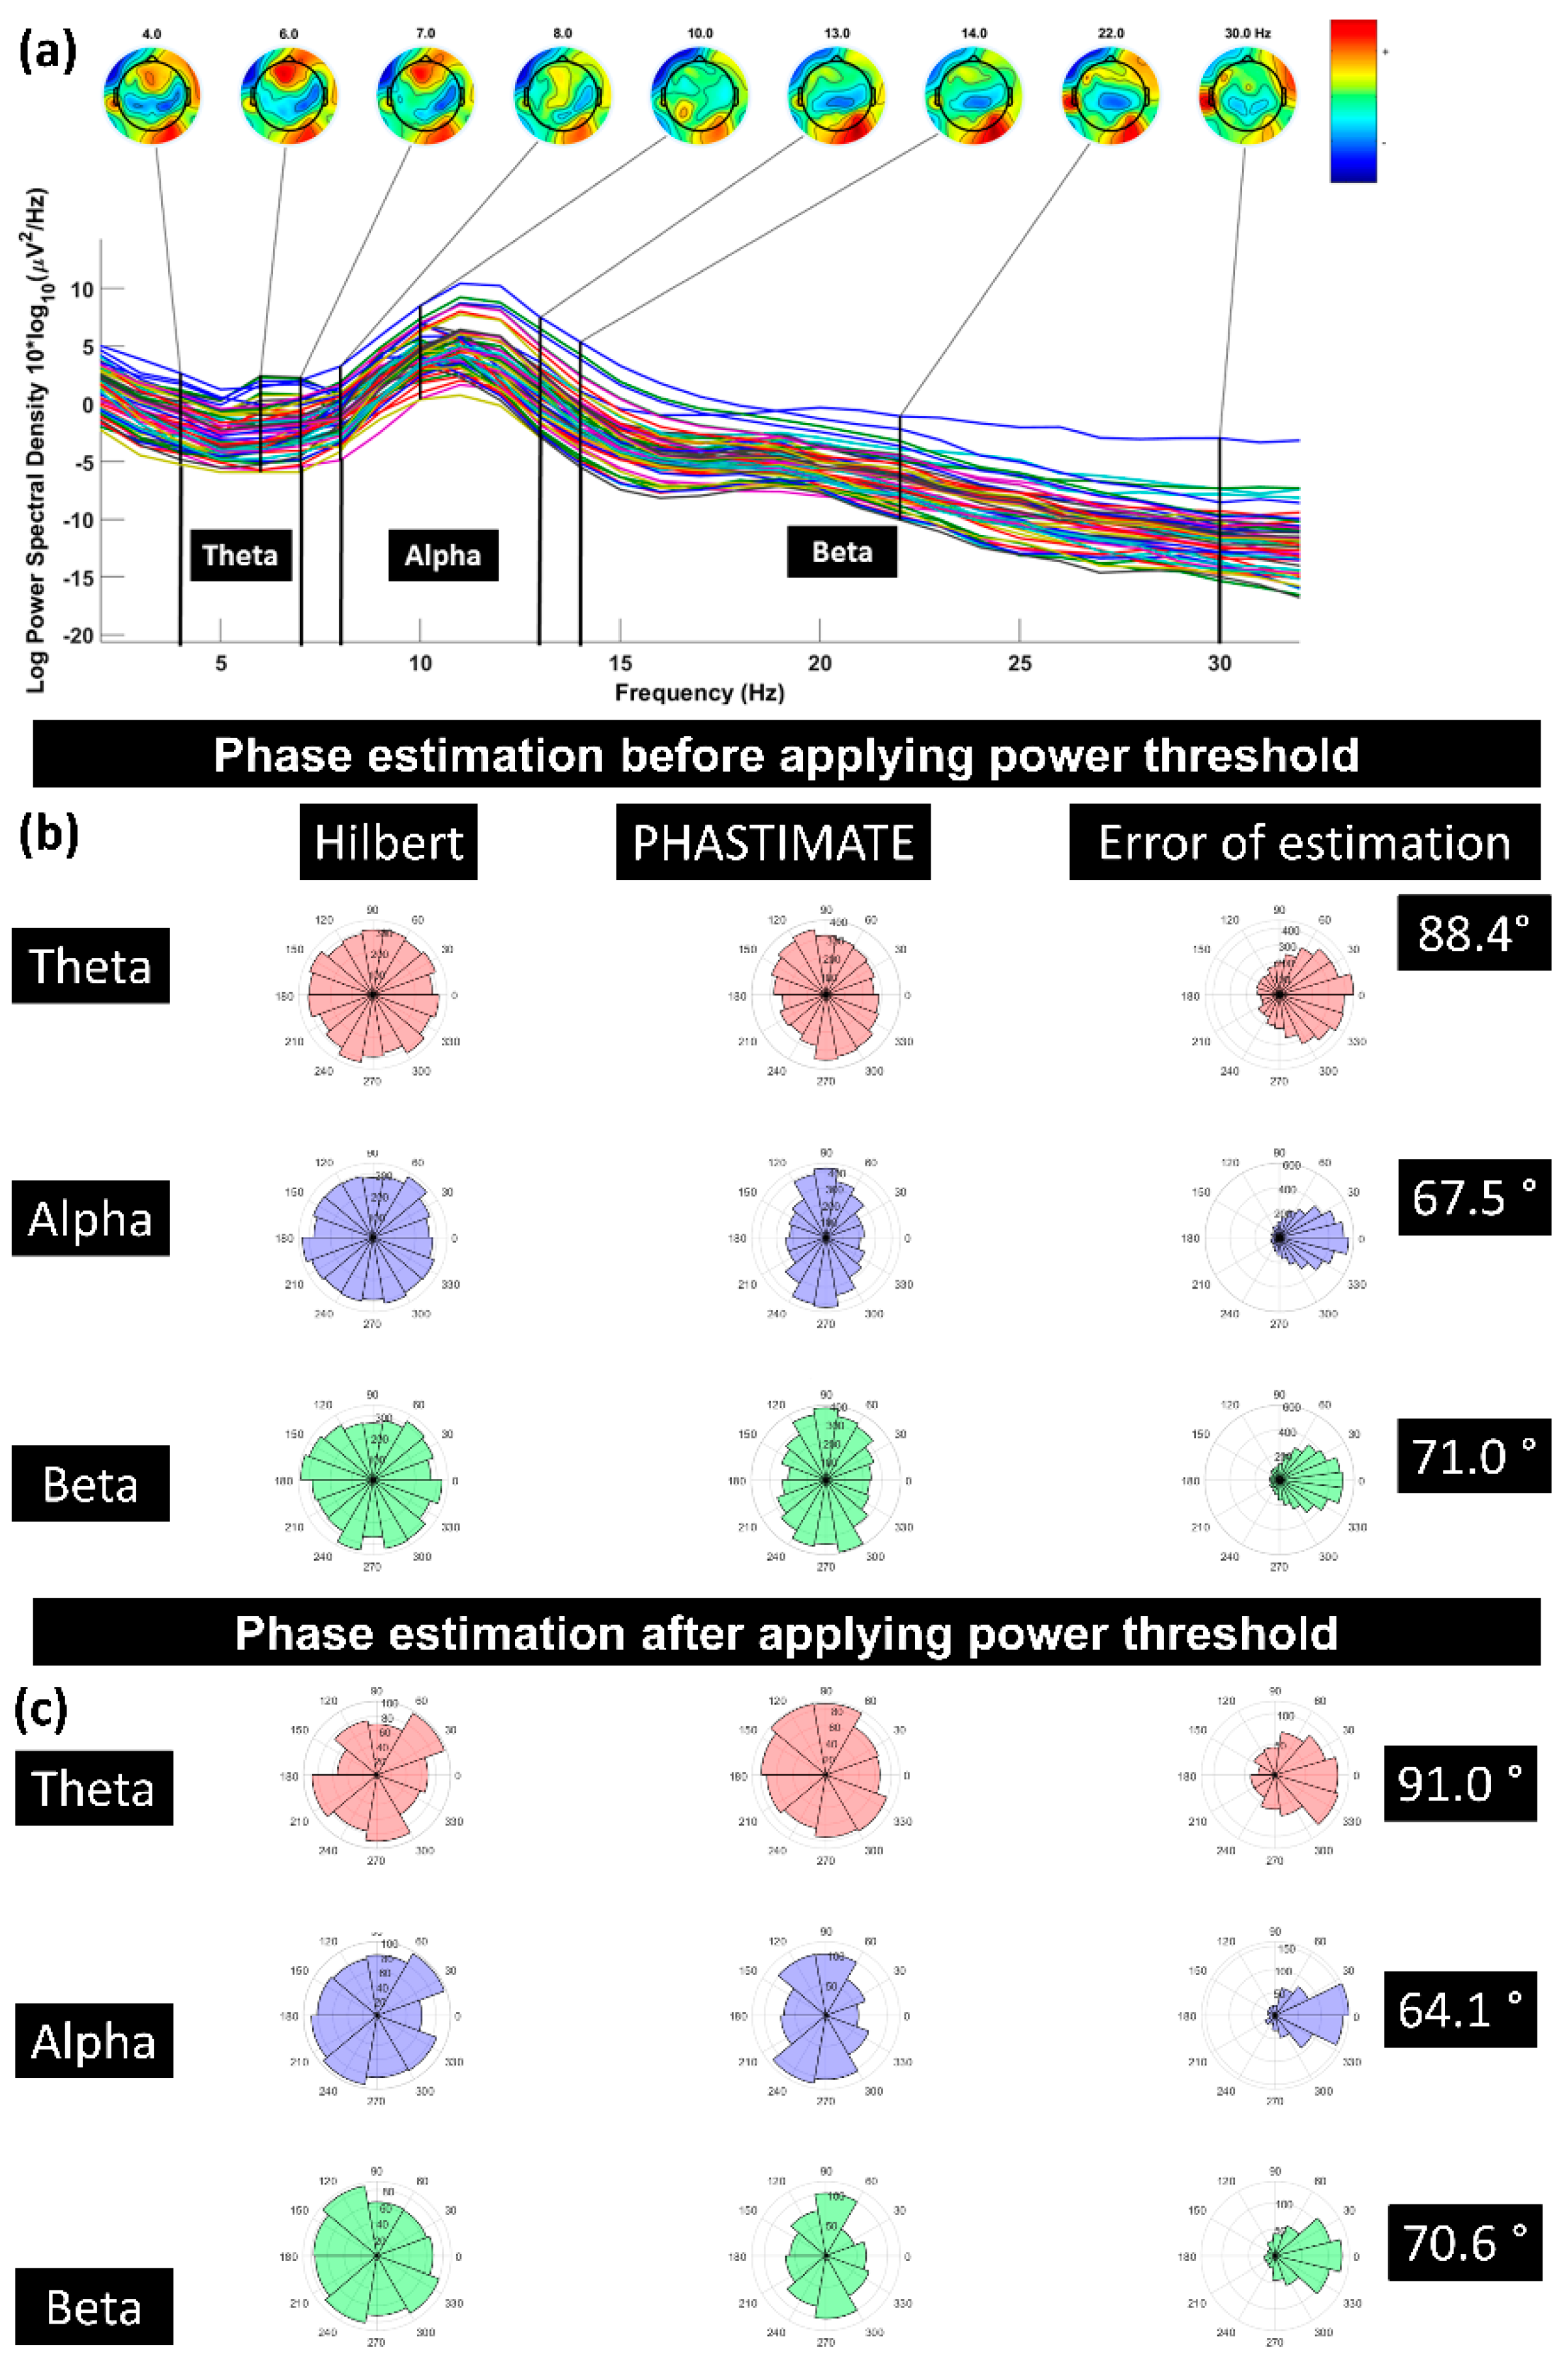
Further, we investigated how pre-stimulus brain states affect TMS responses. In Poorganji et al. (Poorganji et al., 2023), analyzing 64 datasets from healthy participants, we found that pre-TMS oscillatory power (but not phase) in theta and beta bands predicted DLPFC excitability. High-power states amplified post-TMS activity, and we introduced a “corrected_effect” metric to isolate TMS-specific contributions from spontaneous oscillations. This highlights the potential for power-thresholded TMS to reduce response variability.
These studies, where I contributed to experimental design, data analysis (e.g., EEG source localization, connectivity), protocol development, and biomarker validation, underscore TMS-EEG’s value for mechanistic insights into prefrontal circuits associated with mental conditions. Looking ahead, I aim to extend this to clinical populations, integrating multimodal data (e.g., fMRI, EEG) for predictive biomarkers in TRD trials, ultimately enabling state-informed, personalized neuromodulation.