Oscilatory and Aperiodic Markers of Convulsive Therapies in Depression
Neurophysiological Biomarkers and Mechanisms of Convulsive Therapies in Treatment-Resistant Depression
In my postdoctoral and research scientist roles at CAMH (Toronto) and UC San Diego Health, I investigated the neural mechanisms of electroconvulsive therapy (ECT) and magnetic seizure therapy (MST) in treatment-resistant major depressive disorder (TRD) using resting-state EEG (RS-EEG) and TMS-EEG. My contributions included conceptualizing, leading data analysis, biomarker development, and linking neural dynamics to clinical outcomes.
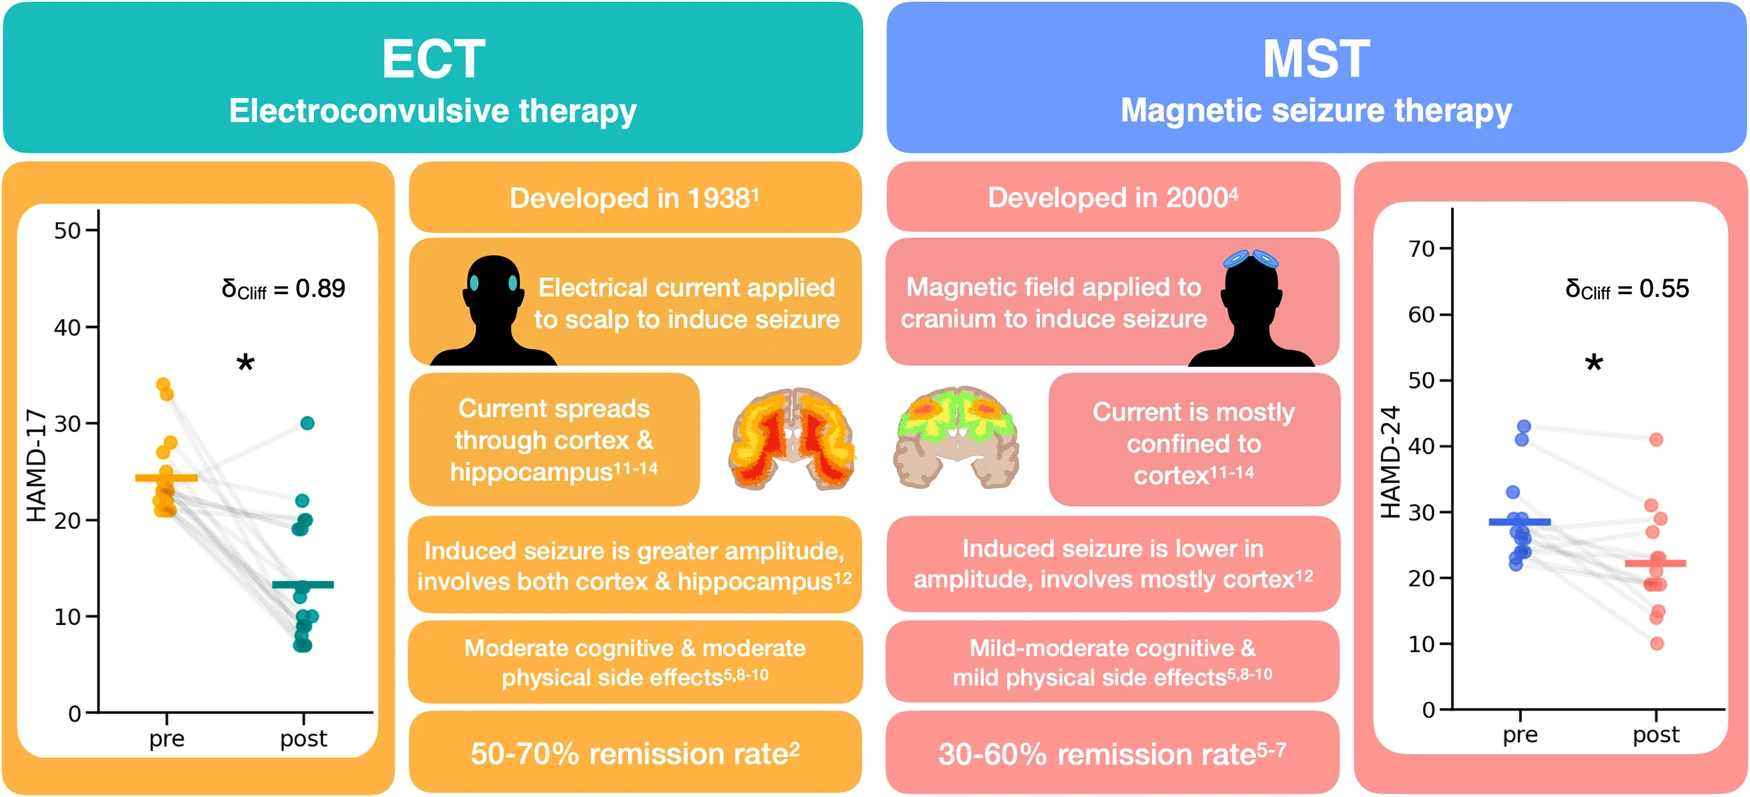
This describes important details of both treatment types, electroconvulsive therapy (ECT), and magnetic seizure therapy (MST). Both treatments are typically only used on patients with treatment-resistant depression and involve inducing a seizure, either with an electrical current or a magnetic field. The main difference is that ECT has a more global spread to subcortical structures and hippocampus, whereas MST affects more local cortical structures. However, both treatment types significantly reduce depression ratings, with MST having a comparable therapeutic effect than ECT. We can see this clinical improvement in the datasets analyzed here, as measured by the HAMD-17 for ECT (pre median(IQR) = 23.0 (22, 24.5), post median(IQR) = 10 (8.5, 19), W(18) = 6, δCliff = 0.89, p = 5.3 ×10⁻⁵) and the HAMD-24 for MST (pre-MST = 26.5 (24, 29), post-MST = 20 (19, 26), W(13) = 7, δCliff = 0.55, p = 2.3 × 10⁻³).
EEG oscilations during rest
Our work began by examining RS-EEG changes following ECT, a highly effective but cognitively burdensome intervention for TRD. In a cohort of 23 patients, we observed enhanced functional connectivity in lower frequency bands (delta and theta) within fronto-central subnetworks, alongside widespread reductions in beta-band connectivity post-treatment. Graph-theoretic analyses revealed increased network segregation (higher clustering coefficient) and reduced integration (longer characteristic path length) in delta/theta bands, with opposite shifts in beta, suggesting ECT promotes a more modular, less globally integrated network architecture that may underlie its antidepressant effects (Hill et al., 2020). These alterations align with clinical “slowing” observed in EEG, potentially reflecting enhanced inhibitory processes in prefrontal circuits implicated in TRD pathophysiology.
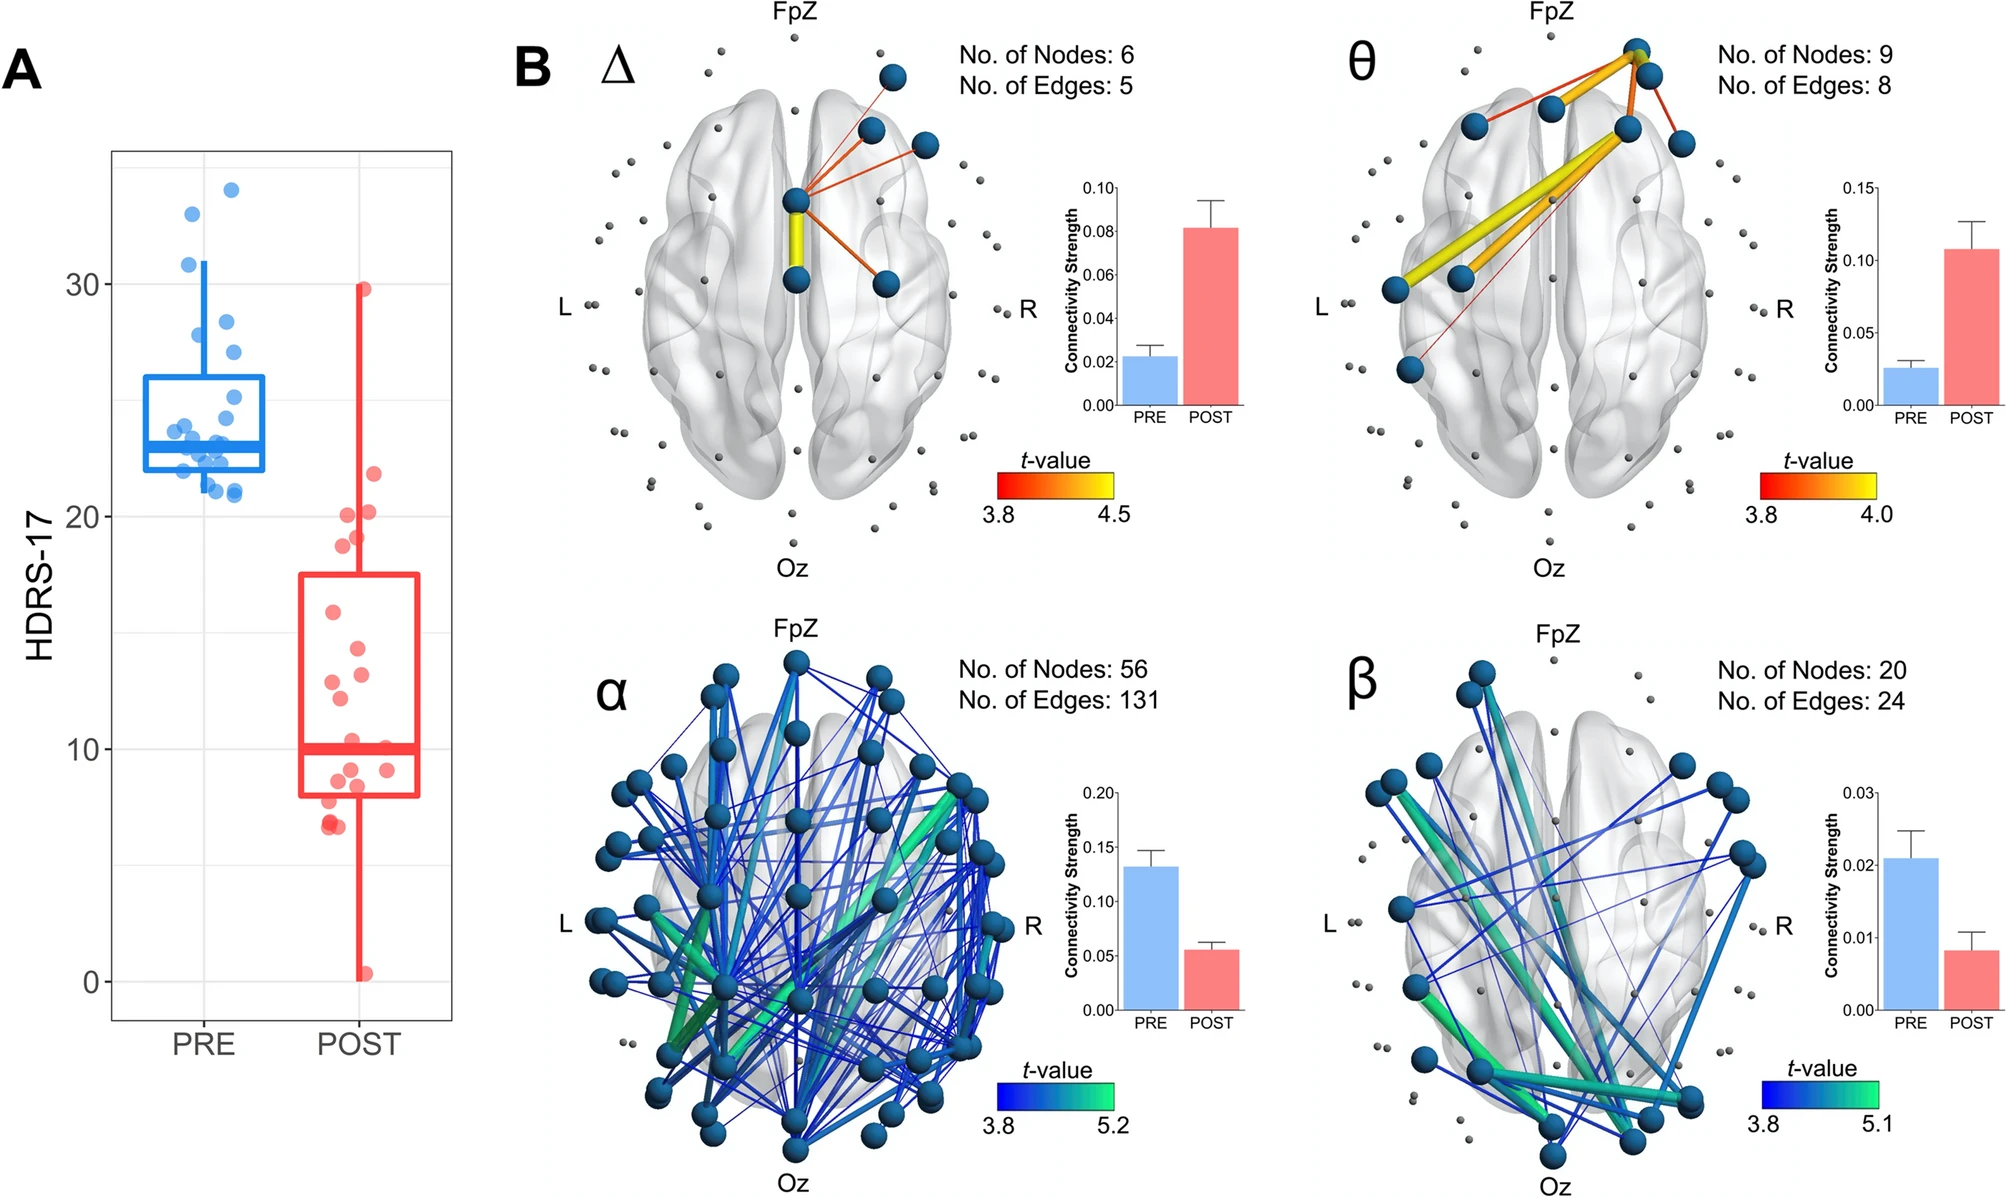
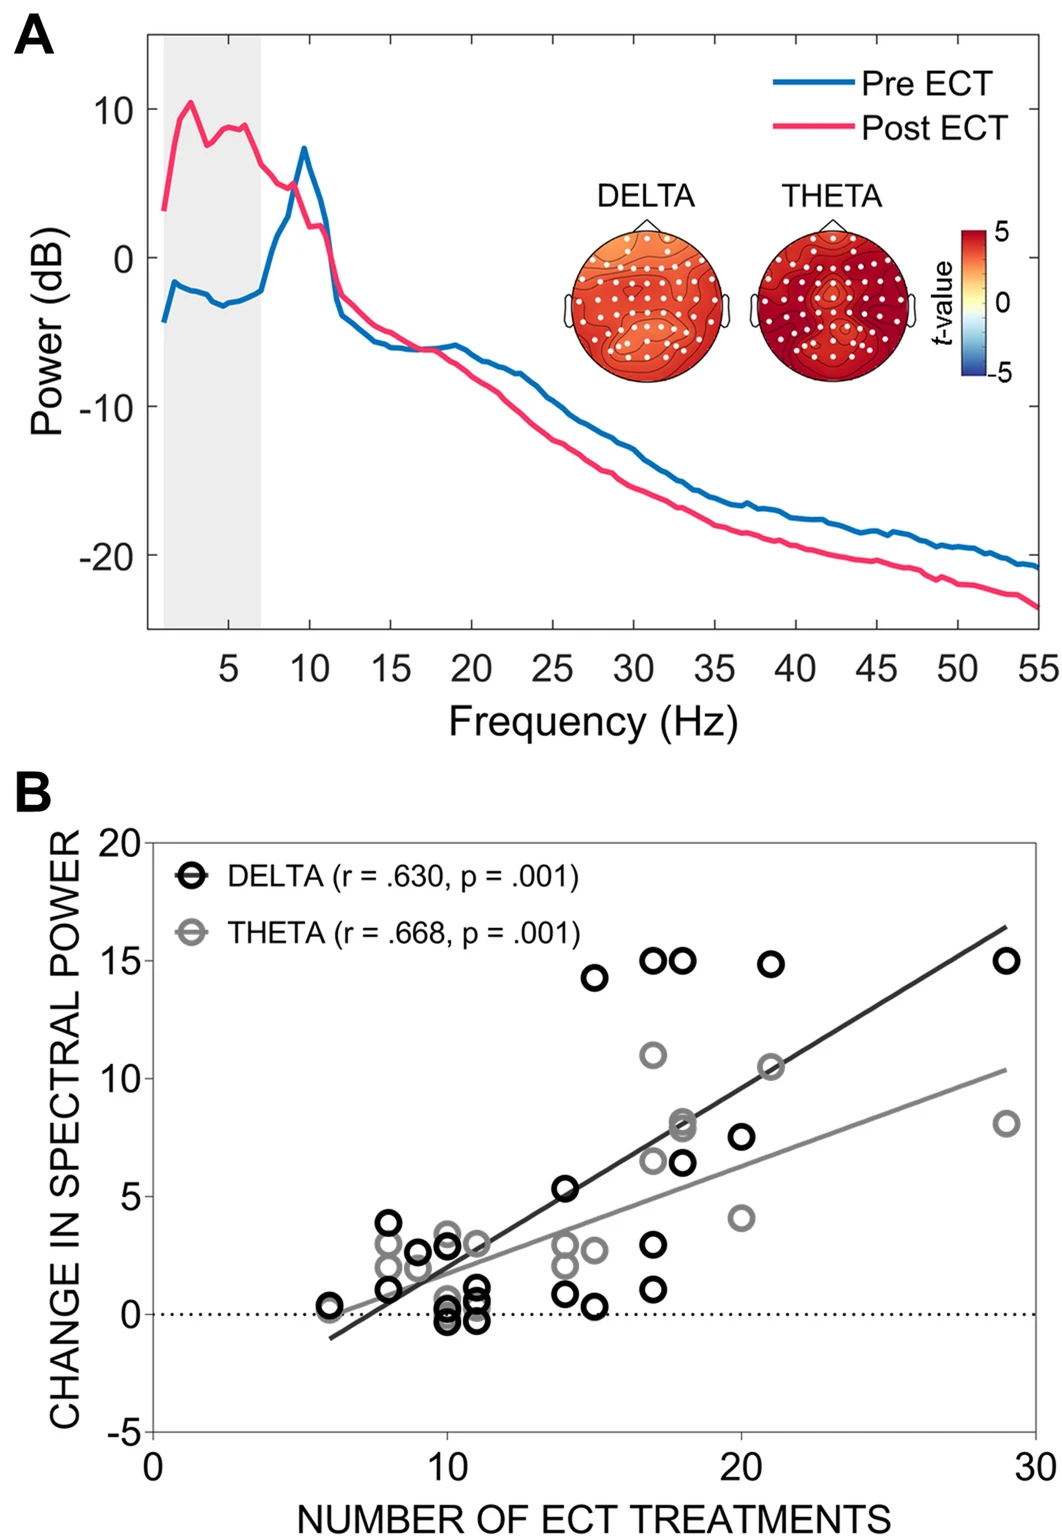
Patient depression scores pre- and post-ECT, as well as network-based changes in functional connectivity. (A) Depression scores (HDRS-17 total score) before and after ECT. (B) EEG connectivity changes following the course of ECT. Images display functional subnetworks identified using the network based statistic (NBS) as showing differences pre-to-post treatment. Networks with edges represented by warmer colours (i.e., delta and theta; top row) indicate a post-treatment increase in connectivity, while cooler colours (i.e., alpha and beta; bottom row) indicate a post-treatment reduction in connectivity. Accompanying bar graphs depict the average connectivity strength across all edges comprising the significant subnetwork (error bars denote SEM). The total number of nodes and edges comprising each significant subnetwork is also presented. Across all MDD subjects the ECT treatment course increased theta and delta connectivity in fronto-central regions, while causing more widespread reductions in alpha and beta connectivity.(A) Spectral power pre- and post-ECT treatment. The vertical grey bar highlights the portion of the graph corresponding to the delta and theta frequency ranges, both of which showed a significant increase in power following treatment. Topographical maps highlight the electrodes (white circles) forming the significant clusters and indicate widespread increases in spectral power (note power is plotted in decibel format to aid visualization). (B) Association between the change in delta and theta power and the total number of ECT treatments received. For both frequency bands, more treatments were associated with a greater increase in spectral power.
In parallel, we extended this to MST, a more focal convulsive therapy with fewer cognitive side effects, in 21 MDD patients. RS-EEG post-MST showed a distinct subnetwork of increased theta connectivity spanning frontal and parieto-occipital regions, coupled with broader beta-band reductions. Topological changes mirrored ECT in part, with greater theta segregation and reduced beta integration, and theta connectivity changes predicted clinical response (measured via Hamilton Depression Rating Scale reductions). This highlights MST’s potential to modulate similar oscillatory mechanisms as ECT but with greater spatial precision, possibly sparing deeper limbic structures like the hippocampus (Hill et al., 2020).
Finite-element current flow model showing the electric field distribution produced by the MST treatment across the cortex (left, anterior view) and deeper brain structures (right, sagittal cross-section).a) Subnetworks identified using the Network Based Statistic (NBS) showing pre- to post-MST changes in functional connectivity derived from the theta and beta frequency bands. Following MST, a subnetwork of increased theta connectivity was observed, along with a subnetwork of decreased beta connectivity. Accompanying bar graphs depict the average connectivity strength across all edges comprising the significant subnetwork (error bars denote SEM). The total number of nodes and edges comprising each significant subnetwork is also presented. b) Results of the receiver operating characteristic (ROC) analysis for theta connectivity. The pre-to-post MST change in theta connectivity predicted responder status with 89% sensitivity and 67% specificity (asterisk).
TMS-EEG oscilations
To delve deeper into cortical reactivity, we employed TMS-EEG, applying single-pulse TMS over the dorsolateral prefrontal cortex (DLPFC) and primary motor cortex (M1) in 38 MDD patients before and after convulsive therapy (24 MST, 14 ECT). At baseline, MDD patients exhibited elevated oscillatory power in delta, theta, and alpha bands over DLPFC compared to healthy controls, indicating heightened low-frequency activity in depression-related circuits. Post-treatment, both ECT and MST attenuated delta/theta power over DLPFC, with ECT additionally reducing alpha power; MST showed no significant M1 changes, while ECT reduced delta/theta there. Notably, alpha power reductions correlated with improved depression severity scores, suggesting TMS-EEG as a sensitive probe for treatment-induced plasticity (Hill et al., 2021).
TMS-related oscillations recorded in HC and MDD cohorts. Top row (A-C): Comparison between the HC and MDD MST cohort at baseline. A) Time-frequency plots (F3 electrode; average across all subjects for each cohort) showing oscillatory power (decibel units, relative to pre-stimulus baseline) following TMS applied over the DLPFC. B) Oscillatory power in the MDD MST cohort minus the HC cohort. The green box highlights the time-frequency window where significant differences in power were found between the two cohorts. C) Topographic plots showing electrodes forming significant clusters (white circles) when comparing the MDD MST cohort and HC cohort for each frequency band. The accompanying box-and-whisker plots show power differences between the two cohorts as an average of all electrodes forming the significant clusters. d-F: Comparison between the HC and MDD ECT cohort (TMS applied over DLPFC).TMS-related oscillations pre and post convulsive therapy. Top row (A-C): Oscillatory power for the MST MDD cohort at baseline and following treatment. A) Time-frequency plots (F3 electrode; average across all subjects for each timepoint) showing oscillatory power (decibel units, relative to pre-stimulus baseline) following TMS applied over the DLPFC. B) Oscillatory power post-MST minus pre-MST. The green box highlights the time-frequency window where significant differences in power were found between the two time points. C) Topographic plots showing electrodes forming significant clusters (white circles) when comparing the pre and post-MST timepoints for each frequency band. The accompanying box-and-whisker plots show power differences between the two timepoints as an average of all electrodes forming the significant clusters. d-F: Pre and post-treatment comparisons for the ECT MDD cohort (TMS applied over DLPFC). G-I: Pre and post-treatment comparisons for the ECT MDD cohort (TMS applied over M1; time-frequency plots taken from C3 electrode).
Aperiodic EEG components
Building on these oscillatory findings, a recent study revisited “clinical slowing” through the lens of aperiodic (non-oscillatory) EEG components, which reflect broadband neural excitation-inhibition balance. In combined ECT (n=23) and MST (n=21) cohorts, we found significant increases in aperiodic activity (steeper spectral slopes) post-treatment, particularly frontally, independent of periodic oscillations. This elevation—linked to greater inhibition—did not directly correlate with remission in this sample but suggests a shared inhibitory mechanism across therapies, potentially explaining their anticonvulsant properties and therapeutic efficacy (Smith et al., 2023).
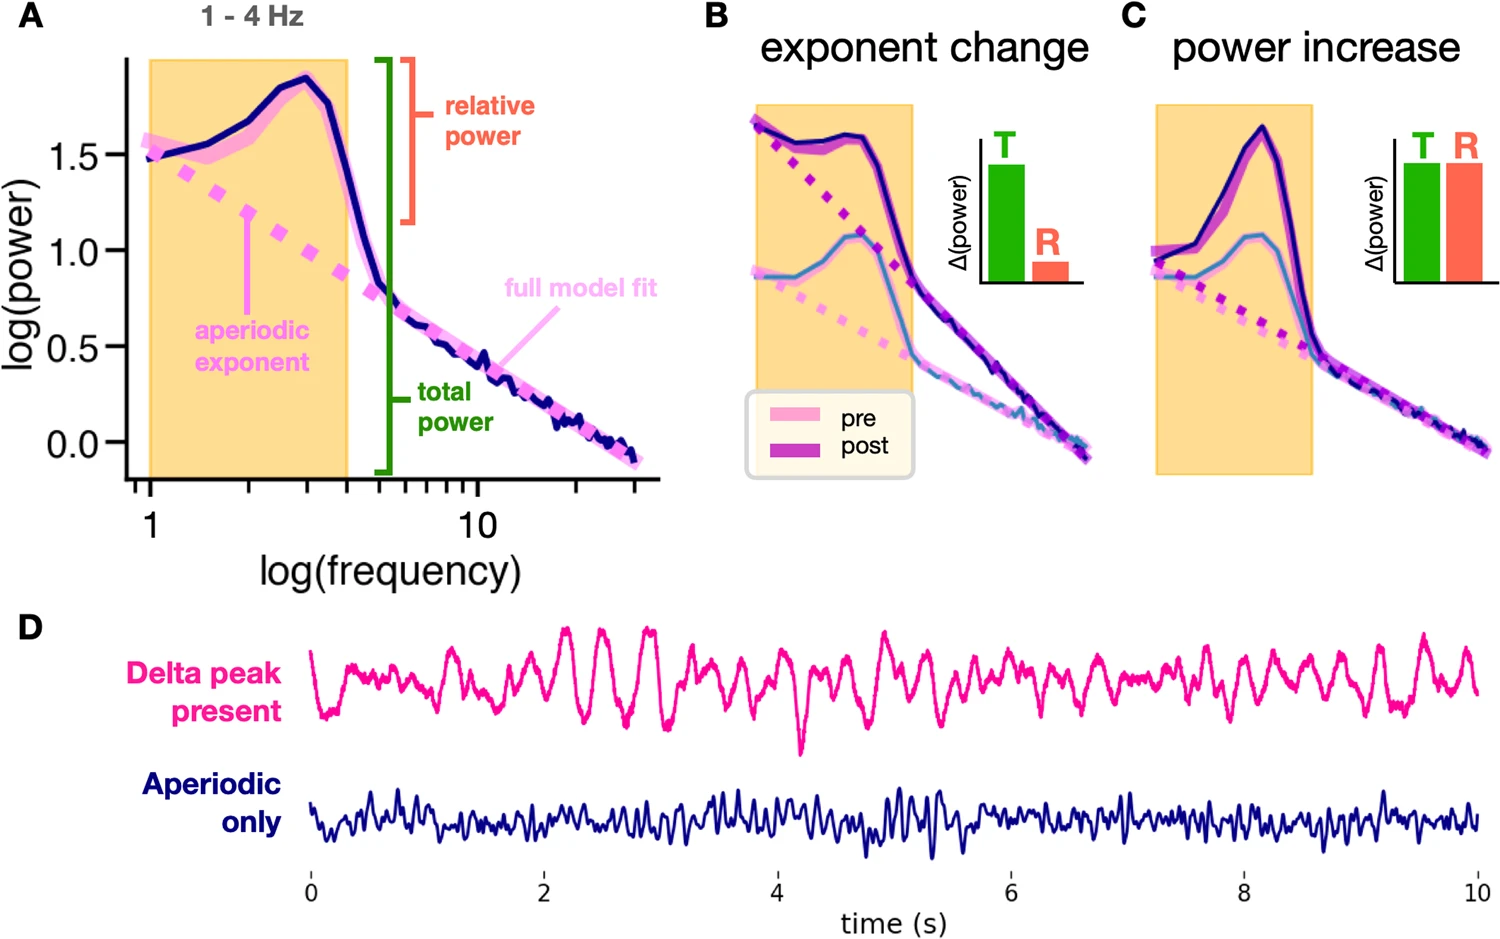
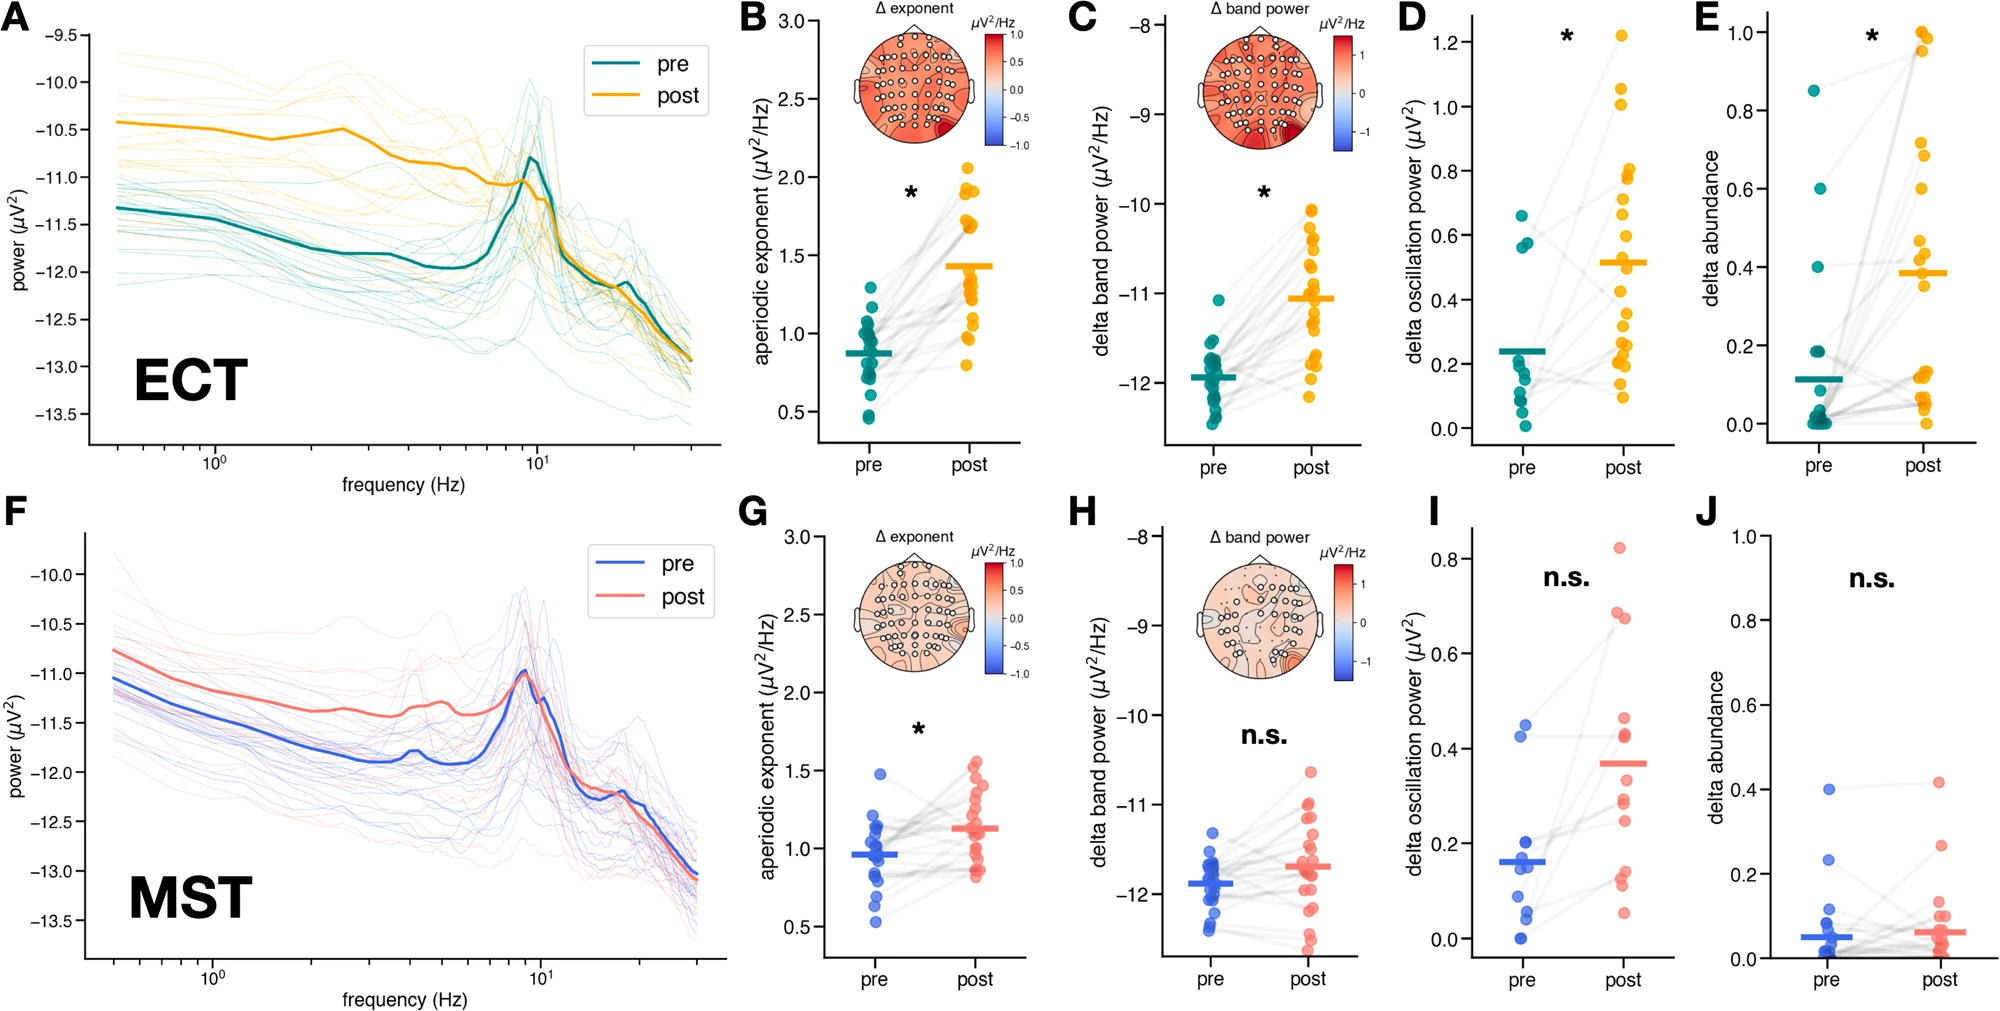
A Simulated power spectrum illustrating parameterized spectra. Unlike traditional band power measures that conflate periodic and aperiodic activity, spectral parameterization defines oscillation power as relative power above the aperiodic component (pink dashed line). B Increases in the aperiodic exponent can cause apparent increases in total (T) band power, while power relative (R) to the aperiodic component remains unchanged. We see this here in a simulated power spectrum depicting an increase in exponent with no delta oscillation changes after treatment. C True increases in oscillation power show increases in both total power and relative power. We see this here in a simulated power spectrum depicting an increase in delta oscillation power after treatment with no change in exponent. D Delta in the EEG trace vs. aperiodic activity. EEG with delta oscillations (where a delta peak is present in the spectra) is visibly different from EEG with only aperiodic activity in the delta band.Spectral differences in aperiodic exponent and delta oscillations in ECT (top) and MST (bottom). A Raw power spectra averaged across channels for each patient pre- and post-ECT. Bolded spectra represent average across patients. B Increase in aperiodic exponent post-ECT (pre = 0.88 ± 0.21 µV2Hz−1, post = 1.25 ± 0.33 µV2Hz−1, t(21) = −9.07, dz = 2.00, ɑadj = 6.25 x 10⁻³, p = 1.05 x 10⁻⁸), inset shows scalp topography of median exponent change, with significant electrodes (p < 0.05) marked in white. C Increase in total power in the delta band post-ECT (pre = −11.88 ± 0.27 µV2Hz−1, post = −11.69 ± 0.51 µV2Hz−1, t(21) = −2.23, dz = 0.45, ɑadj = 1.25 x 10⁻², p = 0.036), inset shows scalp topography of median delta band power change, with significant electrodes (p < 0.05) marked in white. D Increase in aperiodic-adjusted oscillation power in the delta band – only 12 out of 22 patients exhibited a delta oscillation peak both pre- and post-ECT (pre = 0.16 (0.08, 0.66) µV2, post = 0.46 (0.23, 0.76) µV2, W(11) = 10, δCliff = −0.26, ɑadj = 5.00 x 10⁻², p = 0.02). Many patients exhibited an emergence of delta peaks post-ECT, hence the increased number of data points in post-ECT. No scalp topography is depicted because delta oscillation presence was not consistent across electrodes and patients. E Increase in the abundance of delta oscillations post-ECT (pre = 0.023 (0, 0.15), post = 0.36 (0.07, 0.67), W(21) = 20.5, δCliff = −0.67, ɑadj = 1.00 x 10⁻², p = 1.77 x 10⁻⁴). F Raw power spectra averaged across channels for each patient pre- and post-MST. Bolded spectra represent average across patients. G Increase in aperiodic exponent post-MST (pre = 0.98 ± 0.18 µV2Hz−1, post = 1.14 ± 0.21 µV2Hz−1, t(21) = −3.06, dz = 0.80, ɑadj = 7.14 x 10⁻³, p = 6.0 x 10⁻³), inset shows scalp topography of median exponent change, with significant electrodes (p > 0.05) marked in white. H No significant change in total power in the delta band post-MST (pre = −11.88 ± 0.27 µV2Hz−1, post = −11.69 ± 0.51 µV2Hz−1, t(21) = −2.23, dz = 0.45, ɑadj = 1.25 x 10⁻², p = 0.036), inset shows scalp topography of median delta band power change, with significant electrodes (p > 0.05) marked in white. I No significant change in aperiodic-adjusted oscillation power in the delta band–only 10 out of 22 patients exhibited a delta oscillation peak both pre- and post-MST (pre = 0.16 ± 0.14 µV2, post = 0.35 ± 0.21 µV2, t(9) = −3.26, dz = 1.14, ɑadj = 8.33 × 10⁻³, p = 9.8 x 10⁻³), with a few patients exhibiting emerging delta peaks post-MST, hence the increased number of data points post-MST. J No significant change in the abundance of delta oscillations post-MST (pre = 0.02 (0, 0.07), post = 0.03 (0, 0.05), W(21) = 62.5, δCliff = −0.15, ɑadj = 5.00 x 10⁻², p = 0.80).
These studies collectively demonstrate that ECT and MST induce widespread, frequency-specific modulations in neural dynamics, with low-frequency enhancements and high-frequency attenuations potentially serving as biomarkers for response. My involvement in developing automated EEG pipelines and validating these markers has informed my future directions: integrating TMS-EEG with advanced imaging (e.g., fMRI/DTI) for circuit-targeted interventions, as pursued in my NARSAD Young Investigator Award and Baszucki Brain Research Grant. This work not only bridges translational neuroscience with clinical application but also paves the way for less invasive, personalized depression treatments—key to my aspirations in academia and industry collaborations, such as those with Deliberate.ai and Salma Health.
References
2023
Magnetic seizure therapy and electroconvulsive therapy increase aperiodic activity
Sydney E. Smith, Eena L. Kosik, Quirine Engen, and 7 more authors
Major depressive disorder (MDD) is a leading cause of disability worldwide. One of the most efficacious treatments for treatment-resistant MDD is electroconvulsive therapy (ECT). Recently, magnetic seizure therapy (MST) was developed as an alternative to ECT due to its more favorable side effect profile. While these approaches have been very successful clinically, the neural mechanisms underlying their therapeutic effects are unknown. For example, clinical “slowing” of the electroencephalogram beginning in the postictal state and extending days to weeks post-treatment has been observed in both treatment modalities. However, a recent longitudinal study of a small cohort of ECT patients revealed that, rather than delta oscillations, clinical slowing was better explained by increases in aperiodic activity, an emerging EEG signal linked to neural inhibition. Here we investigate the role of aperiodic activity in a cohort of patients who received ECT and a cohort of patients who received MST treatment. We find that aperiodic neural activity increases significantly in patients receiving either ECT or MST. Although not directly related to clinical efficacy in this dataset, increased aperiodic activity is linked to greater amounts of neural inhibition, which is suggestive of a potential shared neural mechanism of action across ECT and MST.
2021
Characterizing Cortical Oscillatory Responses in Major Depressive Disorder Before and After Convulsive Therapy: A TMS-EEG Study
Aron T. Hill, Itay Hadas, Reza Zomorrodi, and 4 more authors
Background Combined transcranial magnetic stimulation and electroencephalography (TMS-EEG) is emerging as a powerful technique for interrogating neural circuit dysfunction in psychiatric disorders. Here, we utilized time-frequency analyses to characterize differences in neural oscillatory dynamics between subjects with major depressive disorder (MDD) and healthy controls (HC). We further examined changes in TMS-related oscillatory power following convulsive therapy. Methods Oscillatory power was examined following TMS over the dorsolateral prefrontal and motor cortices (DLPFC and M1) in 38 MDD subjects, and 22 HCs. We further investigated how these responses changed in the MDD group following an acute course of convulsive therapy (either magnetic seizure therapy [MST, n = 24] or electroconvulsive therapy [ECT, n = 14]). Results Prior to treatment, MDD subjects exhibited increased oscillatory power within delta, theta, and alpha frequency bands with TMS-EEG over the DLPFC, but showed no differences to HCs with stimulation over M1. Following MST, DLPFC stimulation revealed attenuated baseline-normalized power in the delta and theta bands, with reductions in the delta, theta, and alpha power following ECT. TMS over M1 revealed reduced delta and theta power following ECT, with no changes observed following MST. An association was also observed between the treatment- induced change in alpha power and depression severity score. Limitations Limitations include the modest sample size, open-label MST and ECT treatment designs, and lack of a placebo condition. Conclusions These results provide evidence of alterations in TMS-related oscillatory activity in MDD, and further suggest modulation of oscillatory power following ECT and MST.
2020
Modulation of functional network properties in major depressive disorder following electroconvulsive therapy (ECT): a resting-state EEG analysis
Aron T. Hill, Itay Hadas, Reza Zomorrodi, and 5 more authors
Electroconvulsive therapy (ECT) is a highly effective neuromodulatory intervention for treatment-resistant major depressive disorder (MDD). Presently, however, understanding of its neurophysiological effects remains incomplete. In the present study, we utilised resting-state electroencephalography (RS-EEG) to explore changes in functional connectivity, network topology, and spectral power elicited by an acute open-label course of ECT in a cohort of 23 patients with treatment-resistant MDD. RS-EEG was recorded prior to commencement of ECT and again within 48 h following each patient’s final treatment session. Our results show that ECT was able to enhance connectivity within lower (delta and theta) frequency bands across subnetworks largely confined to fronto-central channels, while, conversely, more widespread subnetworks of reduced connectivity emerged within faster (alpha and beta) bands following treatment. Graph-based topological analyses revealed changes in measures of functional segregation (clustering coefficient), integration (characteristic path length), and small-world architecture following ECT. Finally, post-treatment enhancement of delta and theta spectral power was observed, which showed a positive association with the number of ECT sessions received. Overall, our findings indicate that RS-EEG can provide a sensitive measure of dynamic neural activity following ECT and highlight network-based analyses as a promising avenue for furthering mechanistic understanding of the effects of convulsive therapies.
Resting-state electroencephalographic functional network alterations in major depressive disorder following magnetic seizure therapy
Aron T. Hill, Reza Zomorrodi, Itay Hadas, and 6 more authors
Progress in Neuro-Psychopharmacology and Biological Psychiatry, Aug 2020
Magnetic seizure therapy (MST) is emerging as a safe and well-tolerated experimental intervention for major depressive disorder (MDD), with very minimal cognitive side-effects. However, the underlying mechanism of action of MST remains uncertain. Here, we used resting-state electroencephalography (RS-EEG) to characterise the physiological effects of MST for treatment resistant MDD. We recorded RS-EEG in 21 patients before and after an open label trial of MST applied over the prefrontal cortex using a bilateral twin coil. RS-EEG was analysed for changes in functional connectivity, network topology, and spectral power. We also ran further baseline comparisons between the MDD patients and a cohort of healthy controls (n = 22). Network-based connectivity analysis revealed a functional subnetwork of significantly increased theta connectivity spanning frontal and parieto-occipital channels following MST. The change in theta connectivity was further found to predict clinical response to treatment. An additional widespread subnetwork of reduced beta connectivity was also elucidated. Graph-based topological analyses showed an increase in functional network segregation and reduction in integration in the theta band, with a decline in segregation in the beta band. Finally, delta and theta power were significantly elevated following treatment, while gamma power declined. No baseline differences between MDD patients and healthy subjects were observed. These results highlight widespread changes in resting-state brain dynamics following a course of MST in MDD patients, with changes in theta connectivity providing a potential physiological marker of treatment response. Future prospective studies are required to confirm these initial findings.